Why should I worry about reproducibility?
If you can’t show how you’ve produced your statistics and drawn conclusions, then you will not be taken seriously. Transform your data analysis to make your work credible and shareable- that’s the secret of reproducibility.
1. Why Excel is not your friend
We all use Excel: everyone with a mobile or laptop can open a .xlsx file and have some understanding of the contents. But It is not your friend. It is not your friend because without some guidance, a colleague looking at your spreadsheets will no clue what you’ve done. Even with you sitting next to them explaining in detail, it can still remain a mystery. If you can find the original file at all, that is.
It is not your friend because your colleague will find it even harder to work out what you have done if you have copy-pasted data without formulas…or the formulas break…or the file gets too large and crashes. Maybe your spreadsheet is the epitome of readability…but after pasting the publication-quality graph into a report, you forget where your spreadsheet is saved.
In fact, there are so many ways in which Excel is your enemy it’s a wonder anyone still uses the program at all.
2. Making your work pipeline less flaky
Let’s assume there must be a better way. While you might think scientists have found the true path, you’d be wrong. Science is all about reproducibility: The same effect comes from the same cause each time. But when researchers have gone back over published data, it turns out reproducibility isn’t particularly evident. Take a look at Ben Goldacre’s excellent website for more. His site is all about medicines. But there are equivalent crises in psychology, ecology, genetics and elsewhere. And you’d have to bet that if a scientific field is not having this crisis, then it’s only because no-one has actually checked.
However, some scientists and some fields have made a real effort to improve. They have collaborated on software such as github, python and so on. They have outlined good practice and created preferred formats. And the conclusion is that once you’ve collected your data it’s all about:
- Wrangling your data into a sensible shape.
- Analysing your data appropriately.
- Presenting your data clearly.
- Archiving your data and analyses so that others can inspect what you have done.
3. Doing it properly
If you want to go the whole hog on reproducibility, I recommend this website. It covers everything: capturing, sorting & analysing data; version control for effective collaboration; archiving; writing academic papers; recommended folder structure for managing the whole process and more.
However, we will look at just one aspect of reproducibility in this blog: How to create a simple structure for your data and analyses so someone else can understand and repeat what you’ve done.
Now make it reproducible
Our goal is to create a workflow to take you from raw data to finished report (or blog, presentation, app or what-have-you). Having a clear idea of your workflow before you start collecting data will make a massive difference to the success of your project. Trust me on this because I have got it wrong several times.
Spend as much time as you can designing your trial. This time is seldom wasted. You should create a ReadMe text file which explains what you were intending to do in your trial before you start. And for each trial, you should set up the relevant folders: data, input, output and code. Make sure you keep a trial diary of your actions and observations while the trial is running. Future you will be grateful.
So the way to conceptualise the workflow is:
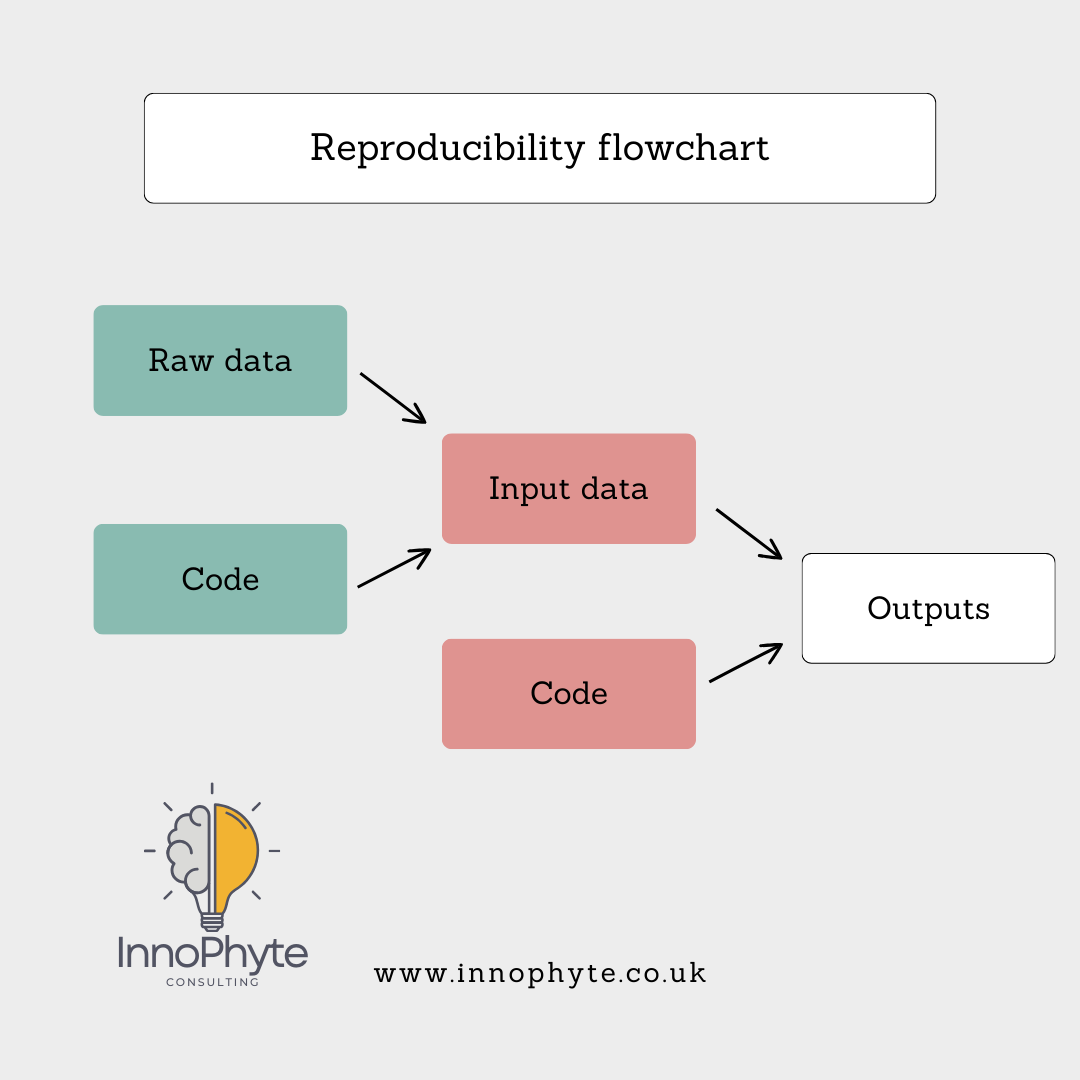
Reproducibility is about organising and analysing your data in a way that another user could follow and execute with ease. Essentially, this means using some sort of statistical software. The two main open source programs are R and Python. I will focus only on R for this blog. R (and R Studio) for your desktop can be downloaded here. Identical functionality can be accessed via Posit Cloud, although you are limited to how much time you can spend using the processing power of Posit’s servers.
I strongly recommend that for each trial (or maybe groups of trials if they are all very similar), you set up the four folders described above: data, input, output and code.
Your raw data goes into the data folder. And you never make any changes to that folder ever again. This commandment is easier to obey if you have planned your data collection sensibly. Your raw data will contain errors and omissions, it might contain notes you recorded at the time. The data might be in a variety of formats – images, text files, Excel files, proprietary data formats and others. It is good practice to ensure your raw data are left in this pre-lapsarian state.
Your cleaned data for use in your analysis goes in your input folder. These data might have been hand-cleaned (which is undesirable as it is much less likely to be documented). Preferably you will use R to extract from your raw data sources only the information you need for your analysis and nothing else. You save the data extracts in inputs…
…and the R code used to extract relevant data in code. You may have one mega-file or lots of smaller modules running parts of your data preparation and analysis. You may also have python scripts and other bits of code you use for, say, image analysis.
To make the best use of your analysis, you should set up a Project in R at the root folder (ie the level above your data, input, outpt and code folders). An R Project ensures that all the relevant libraries and versions of R are contained in the correct place to run the analysis at any point in time. If you are using Posit cloud to run your R scripts (or Python code, see my earlier blog about Time Series), you are pretty much forced to create a project. If, on the other hand, you are using R on your desktop to analyse your data, you will have to set up a project voluntarily. The quickest way is to hit file->New Project and take the existing folder option. Give your project a sensible name.
Save all your new R scripts to the code folder. Give them short informative names. As you have created a Project, R will know your file path, so saving your code, inputs, outputs will be straightforward (the file path to your root folder will be “./”)
In your output file you can place all the results of your analyses. The contents might include manipulated images, figures, flow charts and other diagrams. You may also wish to save tables of results and the outcomes of any statistical tests you run. Give these sensible names too.
Still not sure what to do? Get in touch.
That’s it for reproducibility. I’ve suggested some extra reading for those who are interested in the nitty gritty. But if you follow these guidelines you will be a long way ahead of the crowd. The most important thing is that by doing it properly, anyone else will be able to get exactly the same results you did in a transparent and repeatable way.
Good luck with your data analysis! If you liked this blog and want to know more, talk to us at hello@innophyte.co.uk or visit the website We’re always there to help with cleaning and analysing your data, and visualising it so your results get noticed.

Dr. Jim Stevens
Senior Innovation Consultant
Hello, I am Jim, one of the consultants at InnoPhyte Consulting! My background is spanning from wine trade, finance, and plant science. I can support you with with grant writing, experimental design, data analysis and much more.
If you need to pick my brains, feel free to get in touch at jim@innophyte.co.uk
Grant and Science Support
Data Analysis
Data Visualisation
Project Manager
Expert Interview Services